
First Time Tableau User!
Updated:
In my previous post, I looked at using Power BI desktop to build visualisations and data stories, I explored the process for importing a text/CSV data file into Power BI, combining visualisations to build reports, and using the interactive features of Power BI to search data sets and filter visualisations by user selections.

Both Power BI and Tableau are very popular and widely adopted tools by businesses and BI users everywhere. It made sense to me to also learn and explore the use of Tableau for building visualisations and data narratives, and since I don’t have any previous experience with this tool, I thought it will be a good exercise to learn how to use this tool and see if I could replicate some of the outcomes I produced using Power BI.
Since this is my first encounter with Tableau as a user, I decided to share my experience in getting started with the tool in this post.
Overview
Tableau, just like PowerBI, has two offerings to get started. Tableau Online and Tableau Desktop.
To use Tableau desktop, the professional edition, the user must obtain a valid Tableau license. Students can register to receive an activation code valid for 1 year at this link. Alternatively, users can choose to use the public edition of Tableau Desktop which allows them get started immediately and for free after they download and install the tool.
Tableau also offers a suite of data preparation tools called Tableau Prep Builder for processing data files in and building data flows, and Tableau Prep Conductor for scheduling, monitoring and administering data flows.
Hello Tableau (Public!)
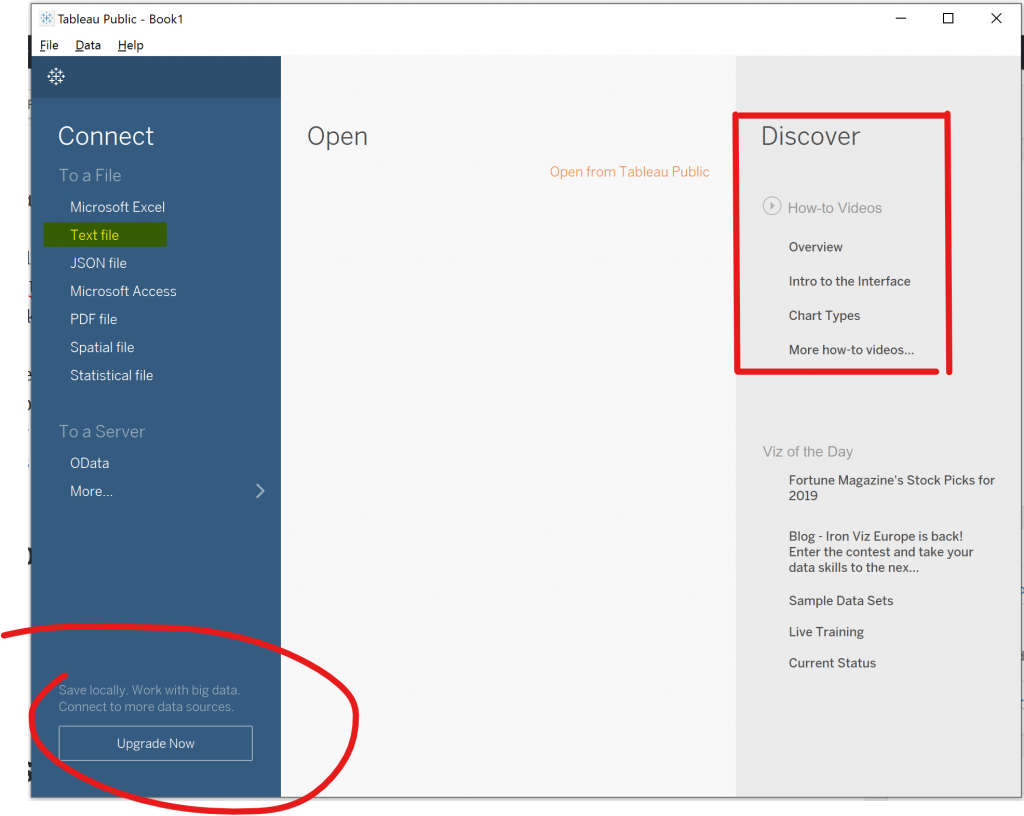
The opening screen in Tablaeu Public presents the option to connect to data files, helpful educational links to get started with the user interface and links to how-to videos.
Data Preparation
Loading a text-based data file is easy, just select Text file on the home screen, point to the file location and click open. Tableau will process the file and open the data set view. In the data set view the user can change import behavior settings to control how the file is loaded, such as the type of field separator in the file: comma, tab or others.
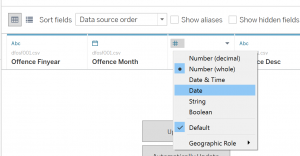
It is often needed to clean and prepare the data set before visualising it. In the same data source screen, the user can also specify data types for various fields, rename, reorder or remove fields form the data set in Tableau.
The NSW roads penalties and offences data set (download it here) is published with data dictionary to describe its content and the fields included in the data set. The data set is relatively clean, all I needed to do is to ensure that the Offence_Month field is recognised as a date field, which Tableau was able to detect automatically. Offence code field was changed from number to string since it is a code field and will not undergo any numerical analysis or processing. Other fields were removed, leaving the data set with the following fields which I intend to use in my visualisations:
| Field name | Data type | Description |
|---|---|---|
| OFFENCE_FINYEAR | String | The financial year of the penalty notice |
| OFFENCE_MONTH | Date | The first day of the month of the penalty notice |
| OFFENCE_CODE | Integer | A unique identifier for the offence |
| OFFENCE_DESC | String | The description of the offence |
| LEGISLATION | String | The legislation creating the offence |
| FACE_VALUE | Number | The penalty amount for the offence ($) |
| TOTAL_NUMBER | Integer | The total number of penalty notices issued |
| TOTAL_VALUE | Number | The total face value of penalty notices issued ($) |
Constructing visualisations
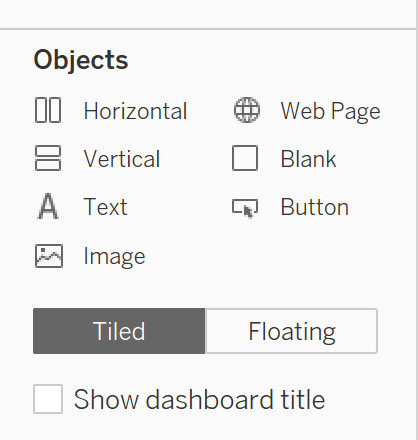
The main visualisation components in Tableau are:
- Worksheet
- Dashboard
- Story
User must first create worksheets to setup individual visualisations according to their requirements.
Worksheets can then be combined together in a dashboard. Dashboards allow interactions between worksheets, this capability provides users with interactive features so they can click on a value in one worksheet and filter other worksheets in the same dashboard based on the selected value.
Worksheets
Worksheets in Tableau allow the user to drag and drop fields, called dimensions, and measures into the columns and rows area of a worksheet, then select the type of plot to display.
The user will go on and create multiple worksheets in order to combine them into dashboards and stories later.
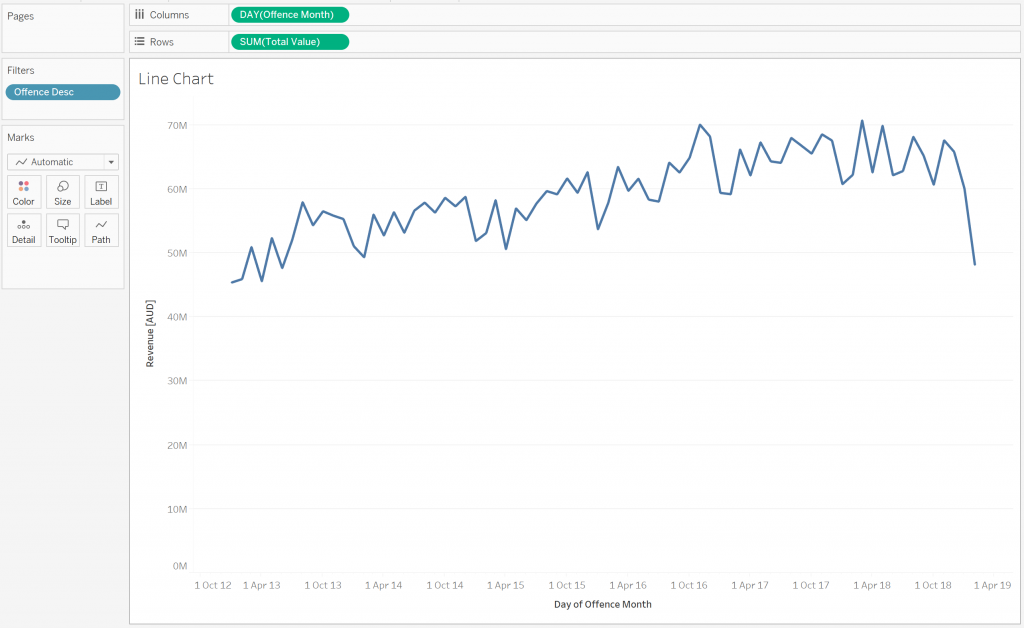
To create the line chart of offence revenue over time I dropped the “offence month” field into the columns section, and the “Total value” measure into the rows section.
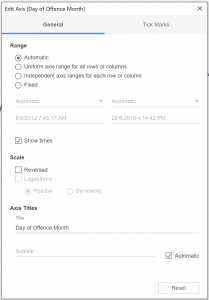
Customising visuals can be achieved by double clicking, or right clicking, on a any element of the chart, e.g to customise the axis title the user needs to double click on the title area and edit axis settings such as Titles and other settings.
Dashboards
Once the user has created one or more visualisations in worksheets, they can drag and drop them into dashboards.
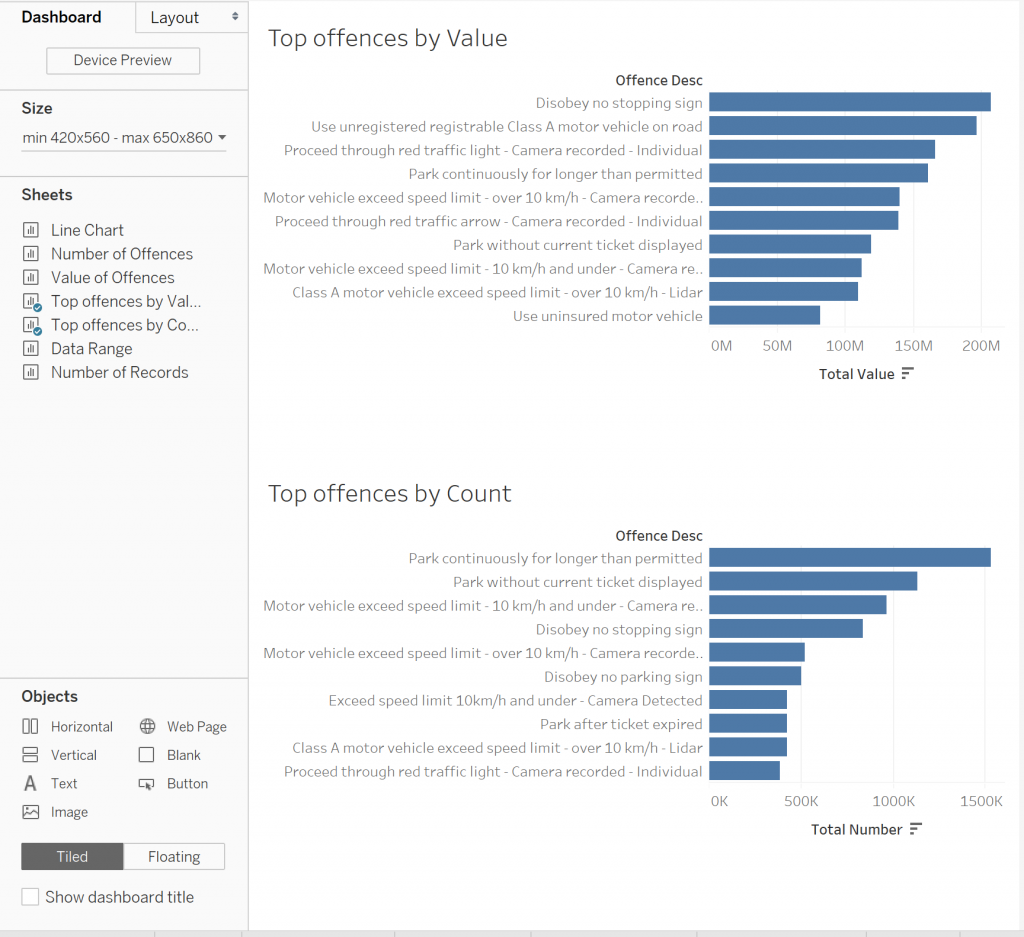
The dashboard in the above figure shows a combination of two worksheets that show top offences by value and by count.
Dashboards will place worksheets (views) in a tiled formation. This is a useful feature to get the dashboard organised easily. Users still have control over how to place worksheets by selecting the option to place views in floating formation, then control the exact size and position of a view.
Story
A story in Tableau contains a sequence of worksheets and dashboards to communicate a data narrative. This feature is very useful when the user wants to convey certain data story by stepping through different visualisations.
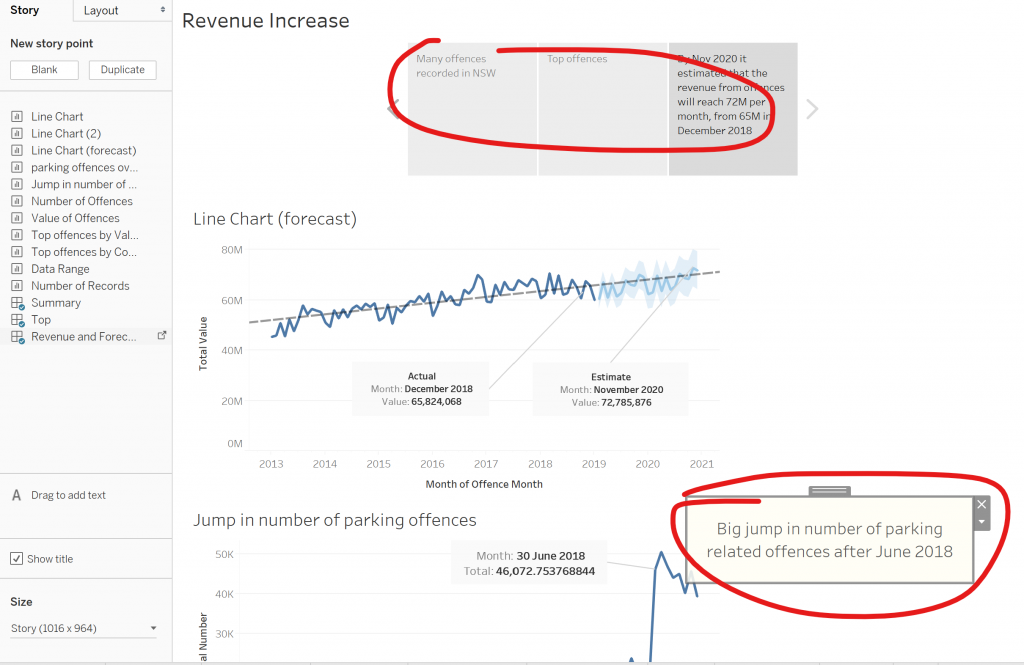
After the user has created all the worksheets and dashboards they need, they can add a story and drag and drop the story elements they want to include in the order to tell the story.
The story navigator on the top allows the user to type their own narrative that goes along with each of the pages in the data story.
What is the predicted revenue 20 years from now?
Tableau offers a feature to forecast time series values into the future by simply right-clicking a data point on the line chart, and selecting the forecast option. Annotations are added to the chart by using the same right-click menu on any data point on the chart.
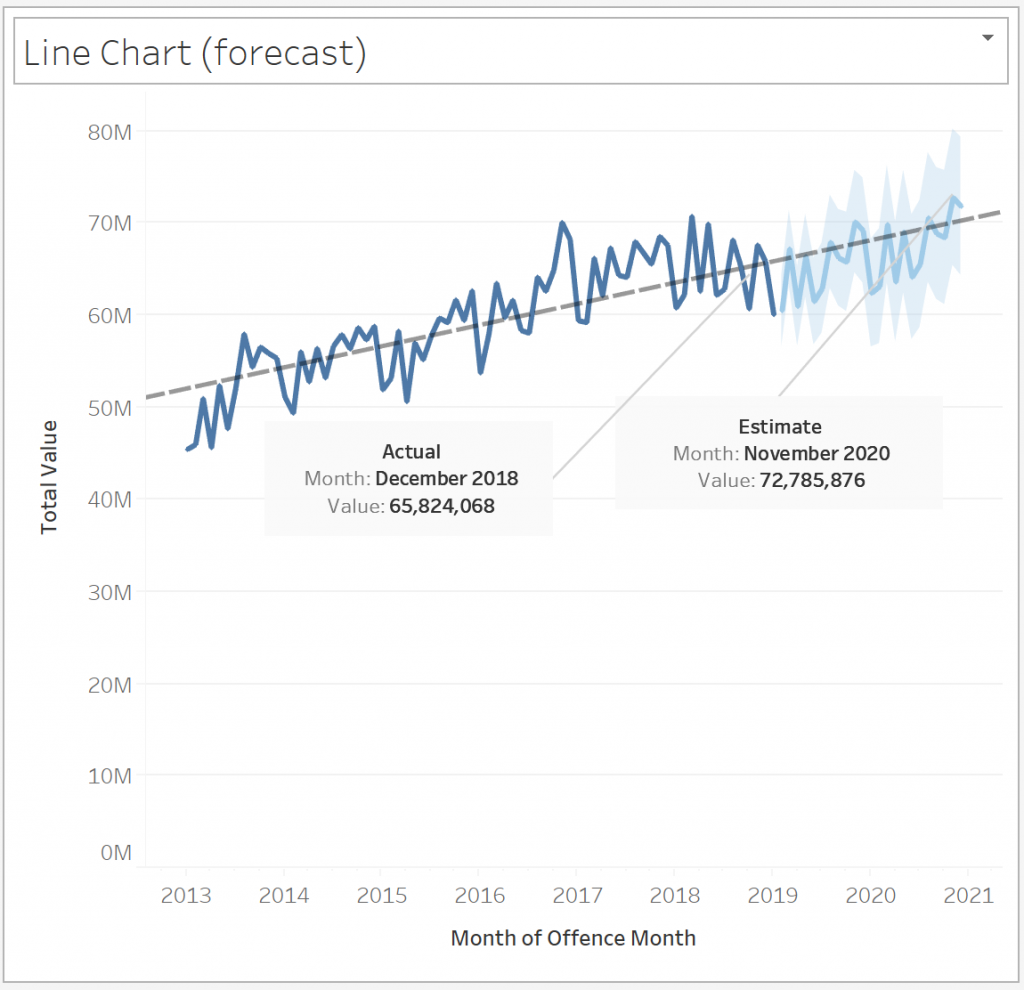
The chart above shows that NSW’s revenue from road offences is expected to continue to grow reaching AUD 72 million per month by Nov 2020, a 7 million per month increase from December 2018!
Data Preparation
If the data preparation needs go beyond the basic capabilities of Tableau desktop, Tableau also offers a more comprehensive data preparation capability.
Tableau’s data preparation user interface represents the preparation process as a workflow of sequenced steps that allow the user to perform operations such as inserting a step, adding aggregate, joining with another data set and adding an output that writes to data connection.
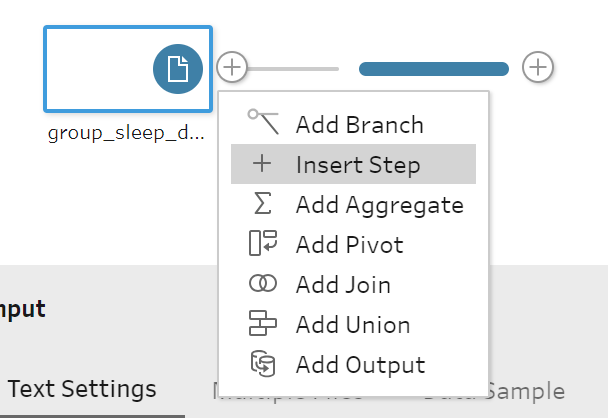
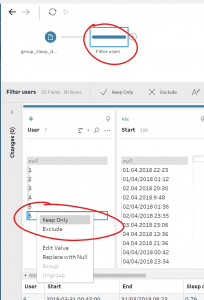
Preparation tasks can be performed in the generic prep steps, first “Insert Step” into the pipeline and then configure the step settings to perform the needed actions, like filtering values, adjusting data types or creating calculated fields.
Conclusion
Learning how to use Tableau was not hard after I understood the basics, I had to watch an introductory video on Tableau’s web site to learn how to navigate through the user interface of the tool.
User must prepare all visualisation elements separately as worksheets before combining them into into dashboards or stories. This approach is different from what I am used to in Power BI, where the user can simply drag and drop a visualisation on a report canvas and construct its settings in place. I am not sure yet if there are benefits to one approach over the other, but it is important to be aware of how dashboards and reports are constructed and combined to be productive in any of the tools.
It is not clear to me yet how it would work if a dashboard contains worksheets from multiple data sources, and how data modelling/relationships are established in this case. I need research this more!
Comments